# Data Ingestion Throttling
# Introduction
The ABB Ability™ Client Success Team has identified an operability behavior with warm path message ingestion when message traffic exceeds the daily ingress rates for the IoT hub or for Time Series Insights (TSI), given the Azure options configured.
The user of this document should be familiar with how device messages pass through the Ability™ Platform, from a directly connected device or via the ABB Ability™ Edge to the IoT hub and finally to TSI. An overview of this architecture may be viewed here.
# Terminology
The terms used in this document correspond with those used to describe the ABB Ability™ Information Model. Three essential terms follow.
# Event
In the IoT hub, an event is an action or occurrence recognized by Azure that is relayed from the ABB Ability™ Edge or from a directly connected device and embedded in a message. In TSI, Microsoft uses the term "event" as a unit of measure for creating a pricing schedule. This TSI "event" equates to all variables, alarms, device events, or telemetry values in a 1:1 ratio. Hence, a TSI "event" is generalized to include any message constituent and is not to be confused with a device event, as e.g. in the IoT hub. Thus, the term can reference either of two different constructs.
# Message
Generically, a message is a container for delivery of device events, alarms, telemetry values, etc. In the IoT hub, messages may contain any of these payloads. For efficiency, multiple events, alarms, etc. can be grouped into one IoT hub message. Once consumed by the IoT hub, messages are sorted into those with and those without TSI formatting. TSI-formatted messages are forwarded to TSI where message constituents are separated into individual TSI "events" (see Event, above). In TSI, each constituent of one message counts as one TSI "event." For example, if a TSI message contains one (device) event and two pieces of telemetry, this will be counted in TSI as three TSI "events."
# Telemetry
Data of a measured process, consisting of the process value and a timestamp, generated by a device and transmitted as part of a message.
# Throttling Conditions
The IoT hub and TSI are serially connected with messages passing through the IoT hub before reaching TSI. Both the IoT hub and TSI can be configured with different levels of ingress rates. If IoT devices send messages to the IoT hub at a rate that exceeds the daily input limit provisioned for the IoT hub, the IoT hub will stop accepting messages. If the IoT hub is provisioned to receive IoT device messages at an ingress rate above the rate TSI is provisioned for, TSI will cache the incoming overflow until the message rate coming from the IoT hub drops below the provisioned TSI rate.
# Examples
# IoT Hub and TSI Under Capacity
ABB Ability™ environments for demonstration purposes are configured with one unit of S1 edition type (ingress capacity) for the IoT hub and one unit of S1 edition type for TSI. At this level, the IoT hub can accept 400,000 messages per day (277 per minute on average) before it stops accepting messages. TSI can accept one million TSI events per day (720 per minute on average). For example, if each IoT hub message contains an average of 2.5 telemetry variables (or fewer) per message at 277 per minute, the TSI ingress limits will not be exceeded and the environment will operate normally (i.e. 277 x 60 x 24 x 2.5 = 997,200).
# IoT Hub Over Capacity
If the IoT hub receives 720 device messages per minute with one event in each message, the IoT hub will stop accepting messages after ~ 9.26 hours each day (720 x 60 x 9.26 = 400,032). Even though TSI can support 720 events per minute, the IoT hub is not provisioned for that rate and stops receiving after 400,000 messages each day. In this case, only 9.26 hours of messages will be available each day. All messages above and beyond the 400,000 message per day threshold will be lost. None of these lost messages will be forwarded to TSI.
# TSI Over Capacity
If the IoT hub forwards 200 messages per minute to TSI, with four pieces of telemetry in each message (i.e. 800 TSI events), TSI will immediately start caching events in excess of 720 per minute, here, 80 (800 – 720 = 80). In this example, the IoT hub is forwarding messages to TSI at a rate that is 111% of the provisioned capacity of TSI. If the IoT hub message forwarding rate and corresponding TSI event ingress rate do not drop to 720 or fewer TSI events per minute (i.e. ≤ 100% of capacity), TSI will never catch up and the gap between the current time and the last time stored will keep increasing.
MESSAGE PATHS
The most recent warm path messages cached in TSI will not be available, as all messages move through the cache on a first in, first out basis. Hot path, cold path, and last value messages WILL be available, as these are not processed in TSI.
# Identifying the Resource Constraint
Determine the current configuration for the IoT hub and TSI. This information can easily be found in the Azure portal. In the Ability Platform environment in question, the configuration for each resource can be viewed.
# IoT Hub
Navigate to the IoT Hub and select Pricing and scale. The display should appear similar to the following.
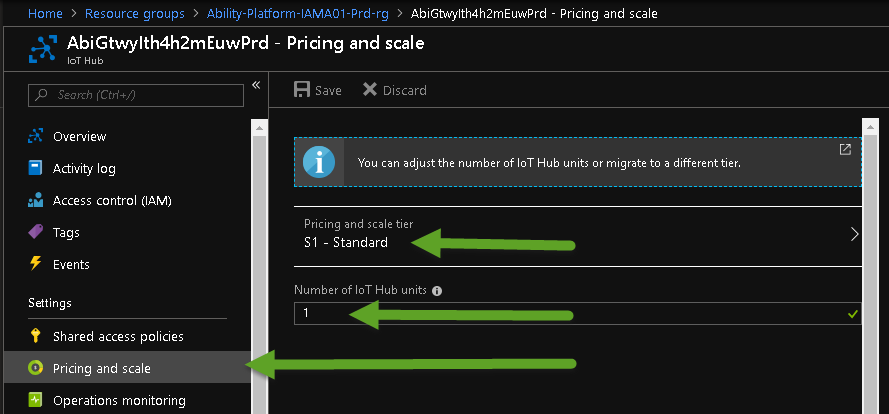
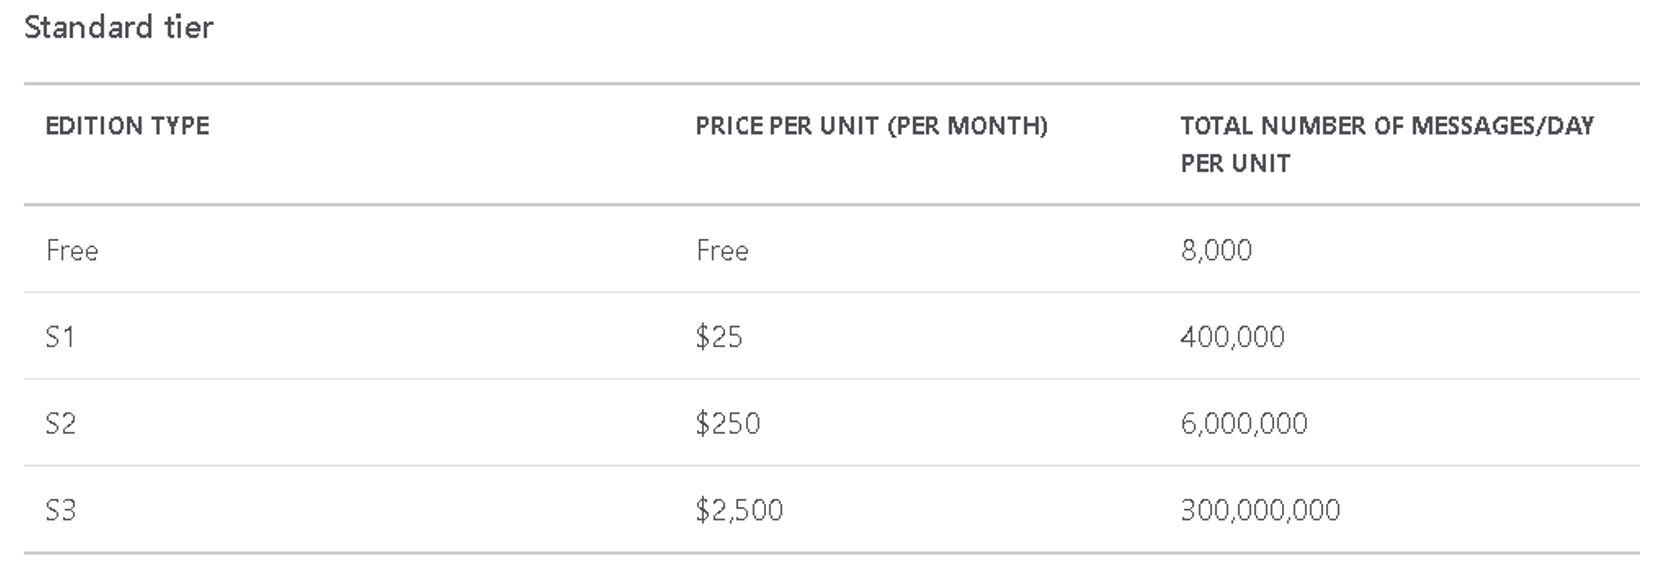
In this example, the edition type (pricing tier) is S1 and the number of units is 1. This can be translated to messages per day from the following table.
# TSI
Navigate to the Time Series Insights environment and select Configure. The display should appear similar to the following.
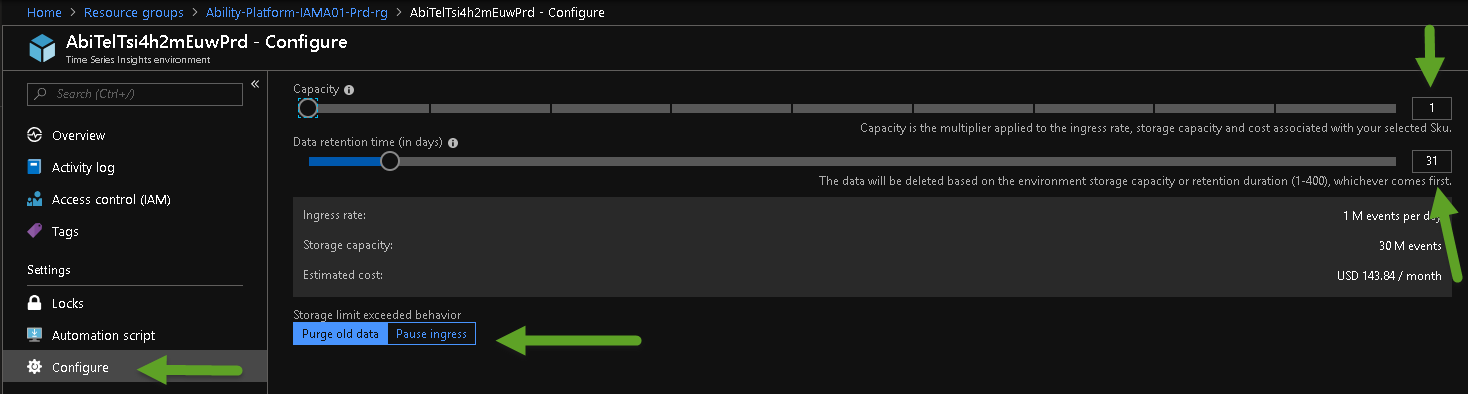
In this example, the edition type is S1 and the number of units is 1. The edition type appears on the Overview page, but this screen can also tell you because the ingress rate is only one million per day. Note that the storage defaults to 31 days. While any change in UNIT will result in a change in cost, the duration can be modified at any time without a change in cost.
NOTE
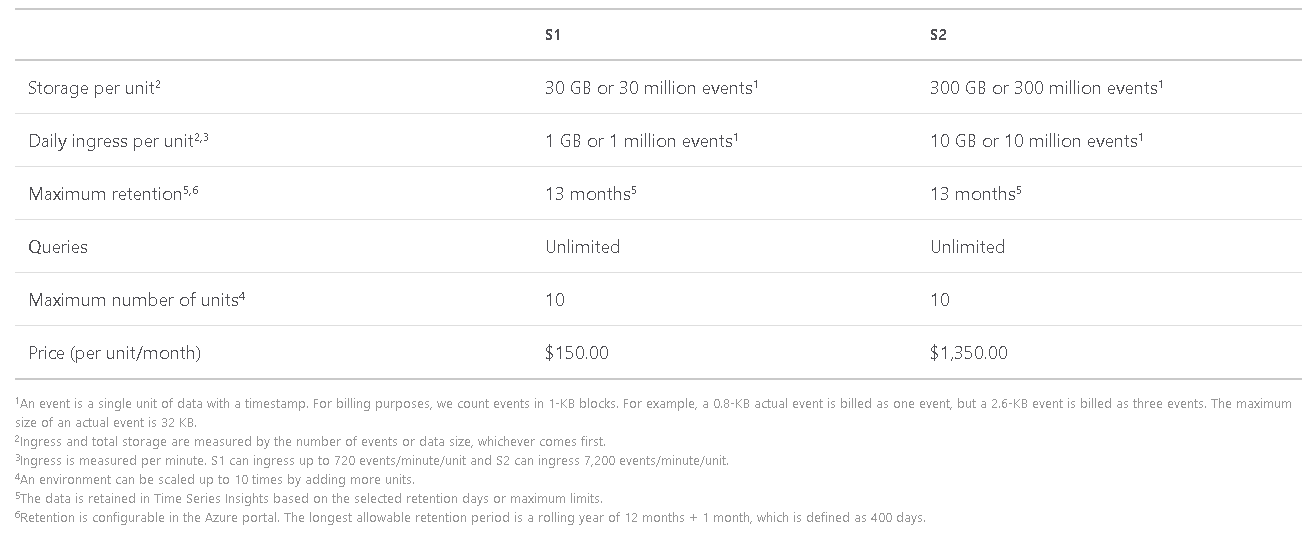
The minimum ingress rate for the S2 edition type is 10 million per day. See following.
Once the edition type and units are determined, you can determine the ingress rate from the following table.
# Analysis
Once the current configuration is determined and the maximum rates for the IoT hub and TSI are known, the Azure Portal can be used to identify when and where there are problems and explain why messages are missing.
# IoT Hub
On the Overview page, the IoT Hub Usage screen displays the maximum number of messages and the current number of messages received today.

The screen also displays a graph that shows the messages ingested over the last eight hours.

The IoT hub resets its counter each day at midnight GMT. If at any time the message ingress surpasses the daily maximum, the graph will drop to zero. You can also click on the Device to cloud messages graph and enter custom time ranges to look back at the last 30 days.
# TSI
On the TSI Overview page, locate the following Monitoring graph.
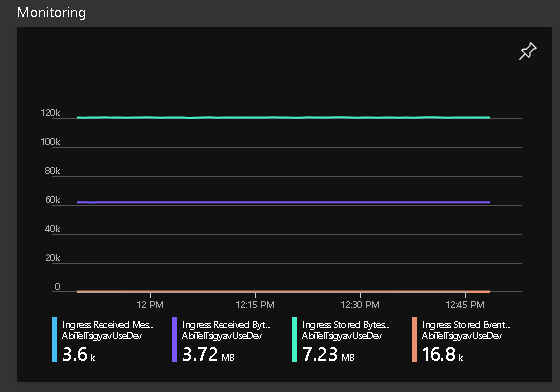
When the graph is clicked, a larger graph appears that allows configuration. The View Classic Metrics screen provides an easier way to look at some of the key parameters.

By selecting View Classic Metrics, check boxes will display that enable selecting from the list of metrics for TSI relevant for troubleshooting missing messages.

Depending on the metrics selected, you can determine the number of messages in and the number of stored events. If two events are in each message, you can expect the number of Stored Events to be twice the number of Received Messages. The important metrics here to determine if TSI is falling behind are Message Count Lag and Message Time Lag. In a heavily loaded system, you can expect up to one minute of lag and maybe 100 to 200 messages at most. In systems that are falling behind, these graphs will be on an upward trajectory. They will not start to go down until the ingress rate drops below the maximum rate supported for the TSI edition type and unit configuration.
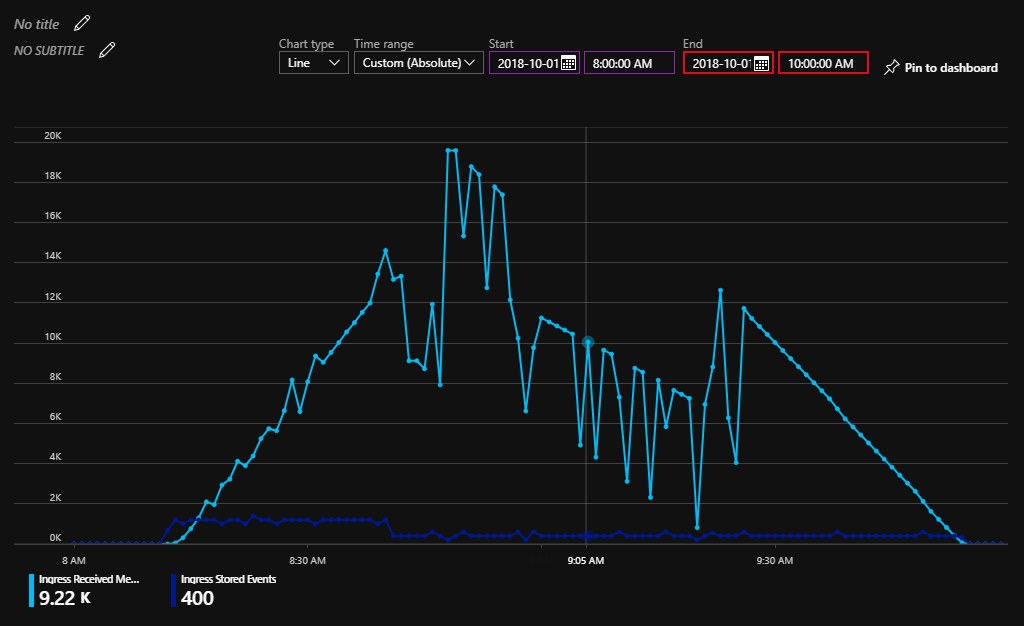
In the graph below, the light blue line is the Ingress of Received Messages Count Lag and the dark blue line is the Ingress of Stored Events (see checkbox list, above). For 30 minutes, the devices tried to send the equivalent of six times the 720 TSI events per minute supported by TSI S1 with one unit. The spike of incoming TSI events lasted for 30 minutes and it took an additional 70 minutes to store the cached events after the input stream had ended.
# Preventing Throttling
If the IoT hub maxes out each day or TSI shows a time and message count lag, either the device messaging rates need to decrease or the IoT hub and/or TSI configurations must be increased. Where Azure configurations are modified, a higher pricing tier is applied. It is recommended that only needed resources be added. For TSI, the maximum ingress for the S1 edition type is 10 million events per day. If a system is needed that requires more than 10 million per day, a new environment configured with S2 should be created (TSI S1 cannot be increased to TSI S2). Otherwise, the edition type and units for the IoT hub and the units for TSI may be revised to enable support for existing loading.