# Displaying Data From The Data Access API Using React
The primary purpose of this document is to provide a practical example of how to pull data from the Data Access API programmatically.
This document will walk the user through creating a simple React web application, pulling data stored in the ABB Ability™ Platform, and displaying the data in a chart using the ChartJS library.
As a note, the ChartJS package is a free 3rd party library. It uses the MIT License. As always, if your team decides to use a 3rd party library for your official code, ensure you are following all appropriate ABB policies involving 3rd party libraries.
# Before You Start
- The following instructions are assuming your machine is running a Windows Operating System
- Make sure that NPM is installed on your machine:
- Instructions found here: Get NPM
- Have a provisioned GA release of the ABB Ability™ Platform instance with telemetry data loaded on it
- Familiarize yourself with the Chart.js documentation for custom configurations: Chart.js
# Create a Test Chart
Open a PowerShell window and navigate to the directory where you want to create the app
Run the command
npx create-react-app <name of app to create>to create the react app filenpx create-react-app test-chart-appOpen created app directory in VSCode, or your editor of choice
Open terminal in VSCode and run following command
npm install react-chartjs-2 chart.js –saveTIP
The above command can also be run in powershell from the created app directory
Under the
srcdirectory, create a subdirectory namedcomponentsNavigate to the
componentsdirectory and create a file named TestChart.jsCreate the basic framework of the TestChart React Component, populate the TestChart.js file with the following lines:
// Import the React components and the Line component of ChartJS
import React, { Component } from 'react';
import { Line } from 'react-chartjs-2';
class TestChart extends Component {
    // The below constructor is required for a React component. It sets the
    // state and requests data from Data Access API
    constructor(props) {
        super(props);
        // State consists of the following
        // -chartData - The information used by the chartJS package, for
        //              displaying chart (USED FOR CHARTING)
        // -rawEndPoint - The Data Access API endpoint to use for retrieving
        //                the raw telemetry data (USED FOR RETRIEVAL)
        // -lineObject - The ID of object being displayed. Passed into the
        //               Data Access API request (USED FOR RETRIEVAL)
        // -lineVariable - The variable to display. Passed into the
        //                 Data Access API request (USED FOR RETRIEVAL)
        // -dateFrom - The date-time to start the query for data. Passed into
        //             the Data Access API request (USED FOR RETRIEVAL)
        // -dateTo - The date-time to end the query for data. Passed into the
        //           Data Access API request (USED FOR RETRIEVAL)
        // -chartTitle - The chart title used by the chartJS package, for
        //               displaying chart (USED FOR CHARTING)
        this.state = {
            chartData: {
                datasets: [
                    {
                        label: props.lineLabel,
                        fill: false,
                        lineTension: 0.1,
                        backgroundColor: 'rgba(75,192,192,0.4)',
                        borderColor: 'rgba(75,192,192,1)',
                        borderCapStyle: 'butt',
                        borderDash: [],
                        borderDashOffset: 0.0,
                        borderJoinStyle: 'miter',
                        pointBorderColor: 'rgba(75,192,192,1)',
                        pointBackgroundColor: '#fff',
                        pointBorderWidth: 1,
                        pointHoverRadius: 5,
                        pointHoverBackgroundColor: 'rgba(75,192,192,1)',
                        pointHoverBorderColor: 'rgba(220,220,220,1)',
                        pointHoverBorderWidth: 2,
                        pointRadius: 3,
                        pointHitRadius: 10,
                        data: []
                    }
                ]
            },
            rawEndPoint: props.rawEndPoint,
            lineObject: props.lineObject,
            lineVariable: props.lineVariable,
            dateFrom: props.dateFrom,
            dateTo: props.dateTo,
            chartTitle: props.chartTitle
        }
        // Call the function that will asynchronously request data from
        // Data Access API
        this.submitRequestData();
    }
    // render function is required to display this component in react
    // NOTE - This displays a chartJS chart, using the state that was defined
    //        in the constructor
    render() {
        return (
            <div className="TestChart">
                <Line data={this.state.chartData}
                    options={{
                        title: { display: true, text: this.state.chartTitle },
                        scales: {
                            xAxes: [{ type: 'time', display: true }]
                        }
                    }} />
            </div>
        )
    }
}
// Export is required by React
export default TestChart;
Add the functions which request the data, add the following code before the
constructorfunction in TestChart.js// Formats the JSON body of the request for data that is going to the // Data Access API submitRequestData() { // NOTE - This is a simple example of a query for raw data. // See Ability documentation for more in-depth understanding // of all the possible queries that can be made this.requestData({ date: { from: this.state.dateFrom, to: this.state.dateTo }, filter: "[objectId]='" + this.state.lineObject + "' AND [variable]='" + this.state.lineVariable + "'", orderBy: { property: "timestamp", order: "desc" }, select: { properties: "value, timestamp" } }); } // Performs the asynchronous call to the Data Access API's Raw endpoint requestData(opts) { var client = new XMLHttpRequest(); client.open("POST", this.state.rawEndPoint, true); client.setRequestHeader("Content-Type", "application/json"); client.setRequestHeader("Accept", "text/plain"); // Setting the onload function to call processRequestDataResponse // for when the call returns client.onload = function () { this.processRequestDataResponse(client) }.bind(this); client.send(JSON.stringify(opts)); return client; }Add the function that processes the results of the data request and converts it into the format needed, add the following code between the
requestDataandconstructorfunctions in TestChart.js// Processes the response from the request for data, and converts it // into the format needed by the ChartJS component processRequestDataResponse(response) { // Only proceed is request status is a success if (response.status === 200) { // Extract the results of the data request into an array var json = JSON.parse(response.responseText); var results = json.data; // Get copy of the chartData from the React state and set to // have no data var datasetsCopy = this.state.chartData.datasets.slice(0); datasetsCopy[0].data = []; // Append each request result to the chartData copy // NOTE - This is the conversion from the request result to the // format needed by the ChartJS component var arrayLength = results.length; for (var i = 0; i < arrayLength; i++) { var result = results[i]; datasetsCopy[0].data.push({ x: result.timestamp, y: result.value }); } // Update the state of this component, using setState function // that is required by React to make the change be picked up by // the children components of this component (i.e. this updates // the chart to display the retrieved data) this.setState({ data: Object.assign({}, this.state.chartData, { datasets: datasetsCopy }) }); } }At this point, the TestChart component is now complete
Make use of the TestChart component by opening
src/App.jsand set code to be the following:import React, { Component } from 'react'; import './App.css'; import TestChart from './components/TestChart'; class App extends Component { render() { return ( <div className="App"> <TestChart rawEndPoint="https://<DA Path>/api/v1/Data/variables" lineLabel="<Line Label>" lineObject="<object ID>" lineVariable="<variable>" dateFrom="12-12-2018 00:00:00" dateTo="12-12-2018 23:18:00" chartTitle="<Chart Title>"/> </div> ); } } export default App;In App.js adjust the parameters[NC5] to work with your ABB Ability™ Platform Instance specifics.
rawEndPointis the path to pull telemetry data from the Data Access APIlineLabelis the name of the line as displayed in the legendlineObjectis the Object ID of the object that has the telemetry data. Used in the pulllineVariableis the Variable that has the telemetry data. Used in the pulldateFromis the start time of the data query. Used in the pulldateTois the end time of the data query. Used in the pullchartTitleis the displayed title for the chart
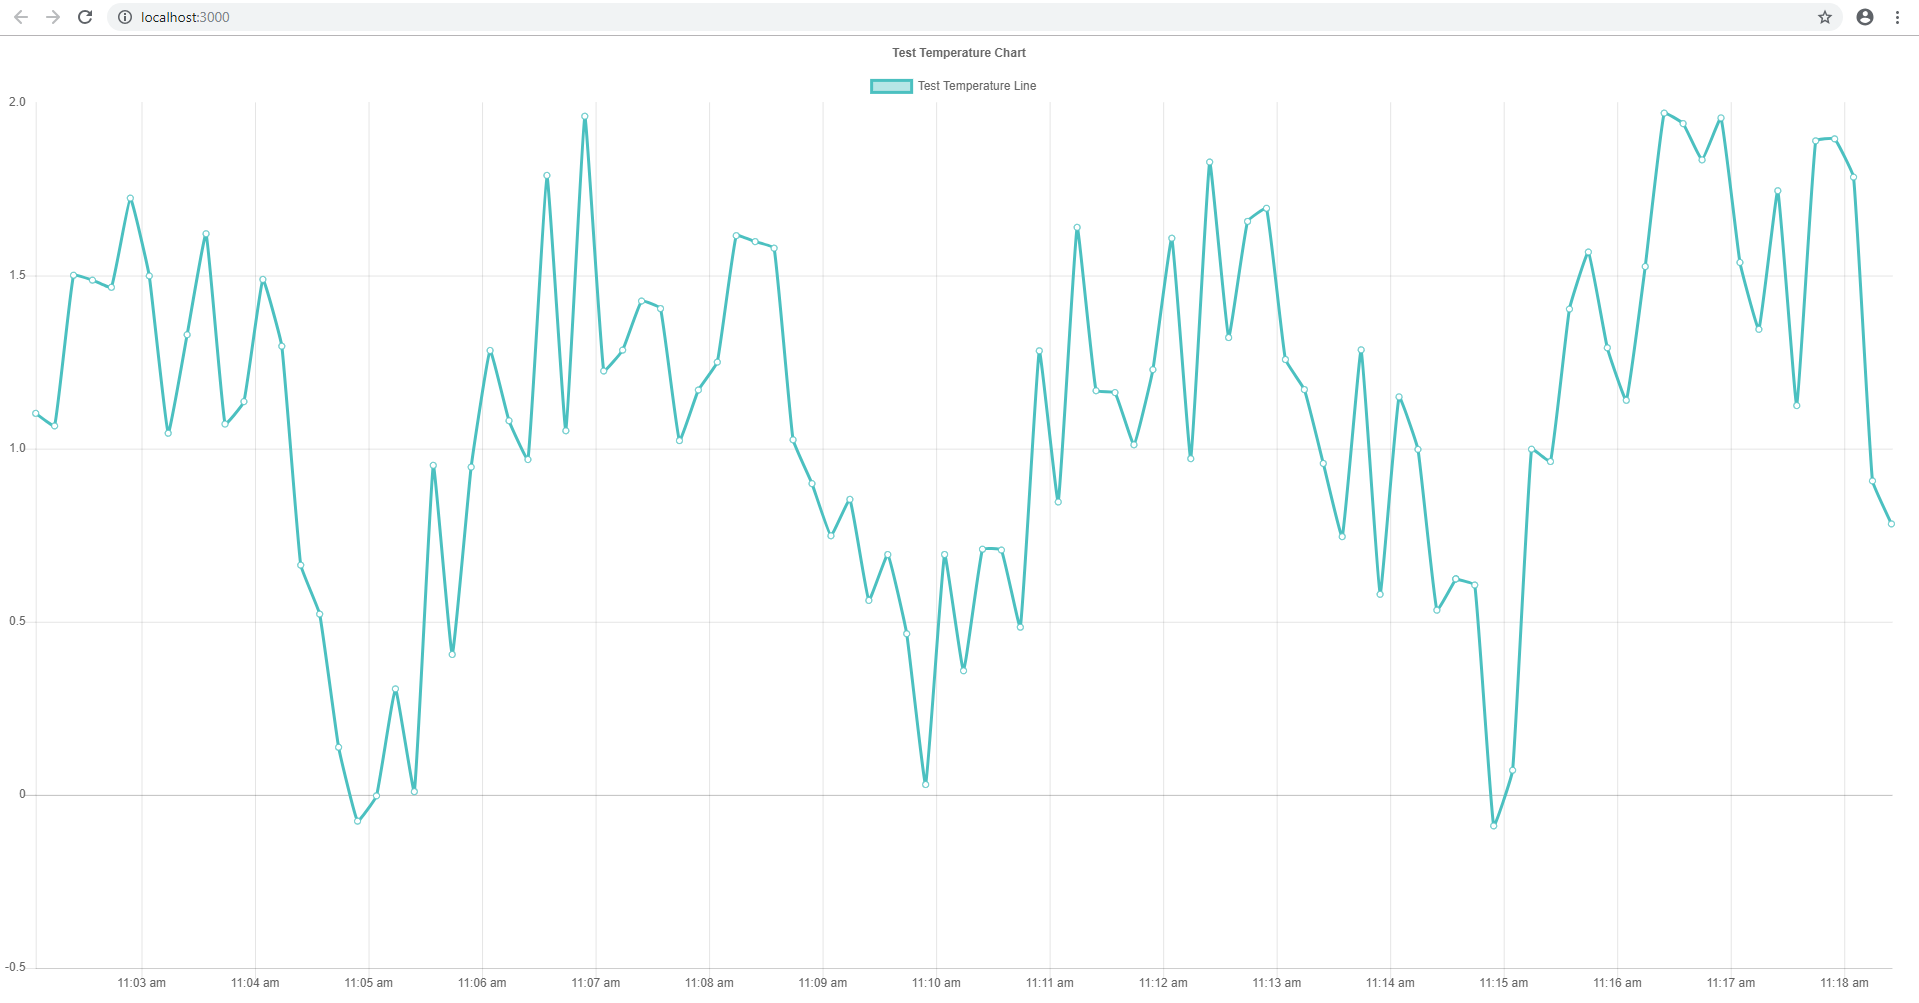
Open terminal in VSCode (or run in Powershell from created app directory) and run following commands
$ npm install
$ npm start
Your default web browser should now pop up and, after a couple minutes, a graph should now be visible with your data displayed