# Remote Debugging of .Net Edge Modules from a Windows Machine
This is part of a series of tutorials which explain how to accomplish various functions within the context of an ABB Ability™ Edge. The Edge runtime makes use of Docker Swarm to orchestrate and run modules in separate containers, which provides the benefits of standardization, compatibility, and easy configuration. Edge modules can be written in a wide variety of programming languages, and simply packaging a custom application as a Docker image will allow it to be run on the Edge.
This tutorial assumes that the source code for the module to be debugged is available on the developer’s local Windows machine. This tutorial will cover and demonstrate:
- Building and deploying the module's image from a Windows machine in a manner that enables remote debugging
- Creating a secure connection between the local machine and Edge host
- Using Visual Studio or VSCode to connect to the remote process and debug the module
# Prerequisite Software
Before continuing in this tutorial, an instance of ABB Ability™ Edge should already be running on a machine separate from where the debugging will take place. For instructions on how to provision an Edge machine, either virtualized or physical, please follow one of the paths listed under the Edge Overview section. Once the module has been created and the Edge device has been set up, there a few tools that need to be installed on the local machine to be used for debugging:
- If the local machine is running the Windows 10 OS (recommended), Docker Desktop for Windows should be installed. If running an earlier version of Windows, Docker Toolbox can be used.
- Either Visual Studio Code (evergreen) or any (2017 or later) edition of Visual Studio. If using Visual Studio Code, the C# extension should be installed.
- For best results, the .NET Core SDK should be installed. The SDK includes the .NET command line interface, which is used in several steps in this tutorial
- PuTTY, an SSH client which will
enable the remote connection to the Edge machine. The .msi installer will include a few related
utilities that are required, including
pscp,plink, andputtygen.
# Publishing the .NET Project
NOTE: The steps in this section should only be followed when building a project for debugging purposes. When building projects for deployment to a production environment, it is strongly recommended to use a Release build configuration for performance reasons. More information can be found here.
To build the .NET project for the module from the Windows developer machine, there are a few steps
to take to make sure that the module can be remotely debugged once deployed to the destination Edge
machine. First, the DebugType on the project file must be set to portable. If this is a .NET
Core project, then this option is set by default and no action is needed. Otherwise, open the
.csproj file for the project and make sure the DebugType is correctly set:
<DebugType>portable</DebugType>
Next, build the project itself in Debug configuration; this will ensure that the corresponding .pdb files used for debugging are included in the build output. Then publish it to add all third-party dependencies to the output folder for Docker to use. This can be done either in your IDE or in a command-line window using the .Net CLI:
dotnet build -c Debug
dotnet publish -c Debug
# Building the Docker Image
Now that the binaries and .pdb files have been created, the Docker image can be built on the Windows machine and deployed to a container registry. More information can be found in the Using Docker tutorial.
# Connecting to the Edge Machine
In order for a debugger on the local development machine to be able to attach the remote Docker container running on the Edge machine, an SSH (Secure Shell) connection will need to be set up between the two machines. For more information about SSH, visit the official documentation here. There are two different authentication methods that can be used: username/password or SSH key pairs. For simple one-time debugging on non-production machines, it will be simpler to connect using a username and password. Otherwise, it is more secure to use an SSH key pair, since they do not involve transmission of passwords in plain text and can be used in automated scripts.
Choose one of the following methods to create the SSH connection:
Username and Password
The SSH connection can be made using an existing username and password on the Edge machine. To
verify that a connection can be made using this method, the plink utility (which is bundled with
PuTTy, and is ultimately used to attach the debugger from the chosen IDE) can be used to confirm in
the Windows command line:
plink {Username}@{IPAddressOfEdge} -P {PortNumber} -pw {Password} echo Hello
For example:
plink ability@12.34.567.890 -P 2222 -pw P@ssw0rd echo Hello
If the connection is successful, you should see “Hello” outputted in the terminal window. If there
is an error making the connection, plink will output an error message outlining the cause of the
error.
Public/Private Key Pair
SSH connections can be authenticated via a pair of two keys: a public key which is stored on the Edge and a private key which will be copied to the development machine and be used to authenticate. To create the key pair, either in a terminal on the Edge machine itself or through an SSH terminal such as PuTTY, run this command:
ssh-keygen -t rsa -b 4096
The ssh-keygen utility is a tool used to create new authentication key pairs. In this case, we
are supplying a few parameters: the “-t” parameter is used to set the type of encryption used, and
“-b” is the recommended length of bits in the key to be created (4096 is recommended, the minimum is
768 and the default is 2048). An optional “-C” parameter can be used if needed to add any comments
to the key pair.
Once the ssh-keygen command has been run, it should provide output similar to this:
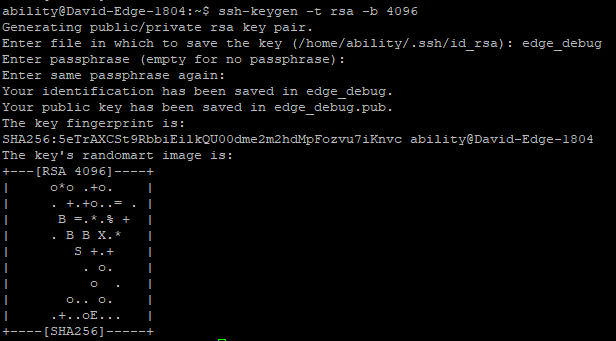
Upon execution, you will be prompted for the name of the file in which to save the key. A file name can be entered, or the default can be used. Passphrase is optional; hit enter twice to save the key pair without a password.
Once the key pair is created, open the public key (reference its location in the output above) and
copy its contents to the clipboard. Next, navigate to the authorized_keys file located in the
“home/.ssh” folder on the Edge machine. Open authorized_keys and paste the contents of the public
key that were copied to the clipboard. This will ensure that the Edge machine is aware of the key
pair and will accept an authentication attempt made with the corresponding private key. Save and
close the file.
Next, copy the private key from the Edge machine to the Windows development machine. There are a variety of ways to do this; one option is using the pscp utility that is installed with the PuTTY application:
pscp {EdgeUsername}@{IPAddressOfEdge}:{PathToKeyOnEdgeMachine} {Destination}
For example:
pscp ability@12.34.567.890:/home/ability/.ssh/edge_debug C:/Keys
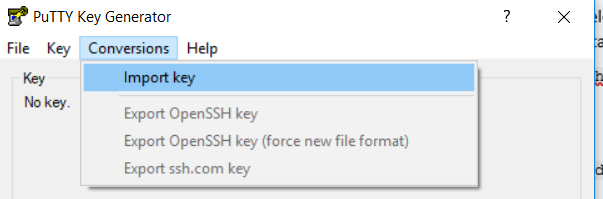
Once the private key file has been copied over, it then needs to be converted from a Linux file to a .ppk file that Windows can use. PuTTYgen, another utility that is included with the PuTTY installer, can be used to do this. Once PuTTYgen is launched, click the “Conversions” tab in the top menu, and then select “Import key”:
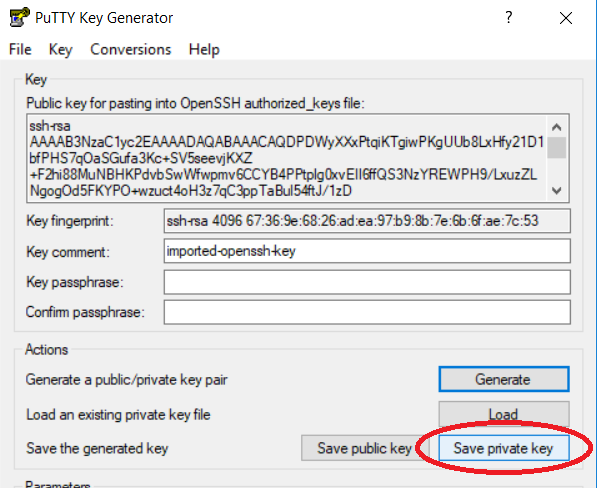
Browse and select the private key file that was copied over from the Edge machine. Once it is loaded, click the “Save private key” button and give it a filename with a .ppk extension:
Now that the Windows private key has been generated, we can test to make sure the connection is
valid before attempting to debug. The debugging connection will ultimately be made through plink
(another utility bundled with PuTTY), so we can use plink as well to test the connection in the
Windows command line:
plink -i {PathToPPKFile} {Username}@{IPAddressOfEdge} echo Hello
For example:
plink -i C:/Keys/ssh_key.ppk ability@12.34.567.890 echo Hello
If the connection is successful, you should see “Hello” outputted in the terminal window. If there
is an error making the connection, plink will output an error message outlining the cause of the
error.
# Debugging in Visual Studio 2019
Start Visual Studio and open the project that is going to be debugged. Similar to debugging a web
application, the project must be compiled before debugging and the code must be exactly the same as
what was compiled into the Docker image being used. First, a JSON file needs to be created which
tells the debugger how to connect to the Edge machine and where to find the Docker container to be
debugged. This JSON file is generally located within the same folder as the project file, but in
reality can reside anywhere on the local machine. It should look like this, with only the red
highlighted text in adapterArgs needing to change depending on which method is used to make the
SSH connection:
{
    "version": "0.2.0",
    "adapter": "plink.exe",
    "adapterArgs": "-i C:\\ssh_key.ppk ability@12.34.567.890 -P 2222 -pw p@ssw0rd -batch -T docker exec -i $(docker ps -qf \"ancestor=abbability.azurecr.io/abb.ability.edge.sample-app:latest\") /vsdbg/vsdbg --interpreter=vscode",
    "languageMappings": {
        "C#": {
            "languageId": "3F5162F8-07C6-11D3-9053-00C04FA302A1",
            "extensions": [ "*" ]
        }
    },
    "exceptionCategoryMappings": {
        "CLR": "449EC4CC-30D2-4032-9256-EE18EB41B62B",
        "MDA": "6ECE07A9-0EDE-45C4-8296-818D8FC401D4"
    },
    "configurations": [
        {
            "name": ".NET Core Attach",
            "type": "coreclr",
            "request": "attach",
            "processName": "dotnet"
        }
    ]
}
The values used for adapterArgs should be similar to what was used in the previous step to test
the connection:
For authentication using username and password:
- The
iswitch with the path of a private key file can be omitted - Replace
ability@12.34.567.890with the username and IP address of the remote Edge machine - Set the value of the
Pswitch to the correct port - Set the value of the
pwswitch to the correct password
For authentication using a public/private key pair:
- Set the value of the
iswitch to the path of the private key file on the local Windows machine - Replace
ability@12.34.567.890with the username and IP address of the remote Edge machine - Set the value of the
Pswitch to the correct port - The
pwswitch can be omitted
For both methods:
- abbability.azurecr.io/abb.ability.edge.sample-app:latest – Replace this with the image name of the
container to be debugged. This can be found by executing
docker pson the remote Edge machine and copying the image of the container from the output.
Once the JSON has been customized appropriately for the remote machine and module to be debugged,
save the JSON file (the exact filename is irrelevant) and copy its path. Then, in Visual Studio,
open the Command window, either by selecting View/Other Windows/Command Window from the top menu
bar, or by entering the hot key combination Ctrl+W, A. In the Command window, run the following
command, substituting the LaunchJson parameter with the path to your JSON debugger configuration
file:
DebugAdapterHost.Launch /LaunchJson:"{PathToDebuggerConfigurationJSON}"
And that’s it! After the few seconds, the debugger should then be connected. Try setting a few breakpoints and make sure they are hit. All debugging functions will be the same as if debugging a local project. When done debugging, be sure to select “Debug” from the top menu and then “Detach All” to detach from the process. If “stop debugging” is selected, the container will still be running, but the dotnet process running the custom module will be terminated. In this case, a manual restart of the container will restart the dotnet process.
# Debugging in VSCode
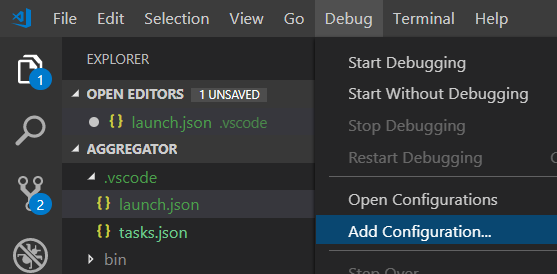
Start VSCode and open the folder containing the project that is going to be debugged. Again, the
code must match what has been deployed in the Docker image and the project must be built before
debugging using dotnet build. Select “Debug” from the top menu bar and then “Add Configuration”:
This will open the launch.json file that VSCode uses to debug projects in the selected folder. It
contains an array of configurations to be used. The JSON configuration for the debugger works in a
slightly different way in VSCode. There should already be a configurations array with a default
value in it. In this case, we will be adding a new configuration to the array. Append the JSON
configuration below to the array in the launch.json file, substituting where appropriate. Here is an
example; only the red highlighted text will need to change:
{
    "name": "Debug Edge Module",
    "type": "coreclr",
    "request": "attach",
    "sourceFileMap": {
        "/sample-app": "${workspaceFolder}"
    },
    "processName": "dotnet",
    "pipeTransport": {
        "pipeCwd": "${workspaceFolder}",
        "pipeProgram": "plink.exe",
        "quoteArgs": false,
        "pipeArgs": [
            "-i C:\\ssh_key.ppk ability@12.34.567.890 -pw p@ssw0rd -P 2222 -batch -T docker exec -i b1b7c40fc9dd"
        ],
        "debuggerPath": "/vsdbg/vsdbg"
    }
}
The “${workspaceFolder}” value is an environment variable within VSCode and represents the currently
opened folder. That text should not change in the configuration JSON. The “sourceFileMap” parameter
tells the debugger how to match the file system in the docker container to the local development
machine. In the example, “/sample-app” is the folder within the container to which the application
binaries were copied when building the image. Refer to the Dockerfile used to build the image to
determine what this value should be. The “processName” is defined as dotnet – within the selected
container, the custom module should be the only dotnet process. Finally, the “pipeTransport”
parameter defines how the connection to the remote machine, and ultimately the Docker container, is
made. Again, the plink utility is used, and only the pipeArgs will need to change, depending on
the method used for authentication
- -i C:\ssh_key.ppk – If using a public/private key pair, replace this with the path to the private
Windows SSH key on the local development machine. If using username and password, remove the
iswitch entirely. - -pw p@ssw0rd - If using username and password, replace this with the correct password. If using a
public/private key pair, remove the
pwswitch entirely. - -P 2222 - Replace this with the port used to make the SSH connection
- ability@40.117.98.150 – Replace this with the username being used and IP (or hostname) of the remote Edge machine.
- b1b7c40fc9dd – Replace this with the ID of the container to be debugged. This can be found by
executing
docker pson the remote Edge machine and copying the ID of the container from the output.
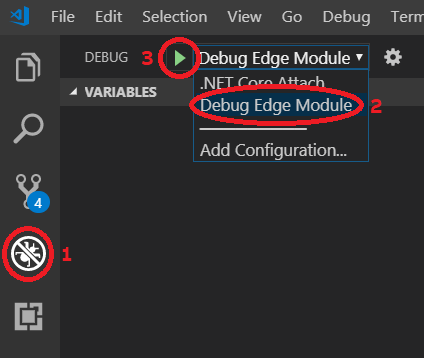
Once the configuration has been added, save the launch.json file. To begin debugging, click the
“debug” icon in the left-hand menu bar, select the debug configuration just added, and click the
“play” icon:
After the few seconds, the debugger should then be connected. Try setting a few breakpoints and make sure they are hit. All debugging functions will be the same as if debugging a local project.