# Troubleshooting Application Insights
# Common Questions
# What is Application Insights
Application Insight is a feature of Azure Monitor, which is a extensible Application Performance Management (APM). This APM is useful for both Developers and DevOps Professionals.
This is a very useful service from Azure to monitor live applications and to detect anomalies. This supports for a wide variety of platforms including .NET, Node.js and Java EE, hosted in on-premises, hybrid, or any other public cloud.
# How does Application Insights Work
To check how Application Insights works, we have to install a small instrumentation package in our platform and enable the Application Insights resource in MS Portal. In this way this service will monitor our application and send telemetry data to Azure Monitor.
We can monitor different components which are working in the background. The snapshot below explains where Application Insights comes into the picture in the Azure Platform.
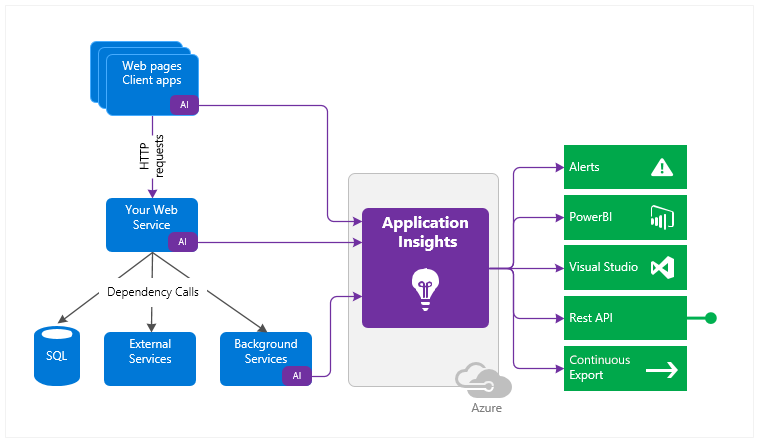
# What does Application Insights Monitor
Here we can see what Application Insights monitors from the platform and how we can troubleshoot issues easily.
Request rates, response times, and failure rates.
Dependency rates, response times, and failure rates: Find out whether external services are slowing down the system.
Exceptions: Analyze the aggregated statistics, or pick specific instances and drill down into the stack to trace related requests. Both server and browser exceptions are reported.
Page views and load performance: Reported by your users' browsers.
AJAX calls from web pages: Rates, response times, and failure rates.
User and session counts.
Performance counters: From your Windows or Linux server machines, such as CPU, memory, and network usage.
Host diagnostics: From Azure or Docker.
Diagnostic trace logs: From your app - so that you can correlate trace events with requests.
Custom events and metrics: Self authored in the client or server code.
# Application Insights Dashboard

Application Insight dashboard gives us performance, failures tiles, and much more. Using this dashboard, we can learn how our platform is performing.
# How can we check logs or telemetry
Here we have multiple ways to see all the logs or data which is collected from Azure Platform under the Investigate section in the portal.
Smart Detection and Manual Alerts: Smart Detection automatically warns you about potential performance problems and failure anomalies in the web application. It performs proactive analysis of the telemetry of the web application which is sent to Application Insights.
Using this Smart Detection, we will receive email alerts if the failure rate suddenly increases, or abnormal patterns in platform performance occur. And for this, we do not need any additional configuration if the deployed application sends enough telemetry.
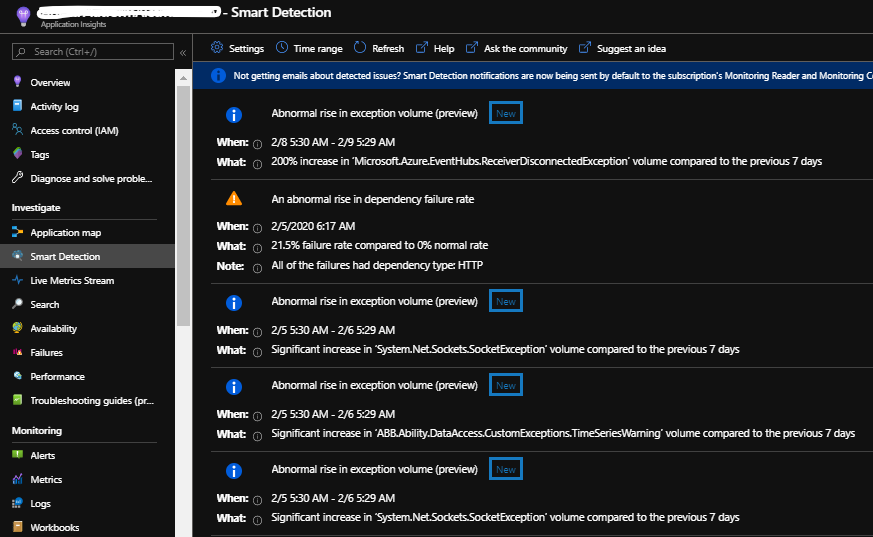
As shown in the above snapshot, we can list all the logs from a platform.
Here, in this Smart Detection blade, we have multiple options to sort logs based on Time Interval. We can drill down selected logs to make the platform up and running without any errors.
The following snapshot helps you to find drill down option (i.e., View detected exceptions to check the logs in detail with time stamp).
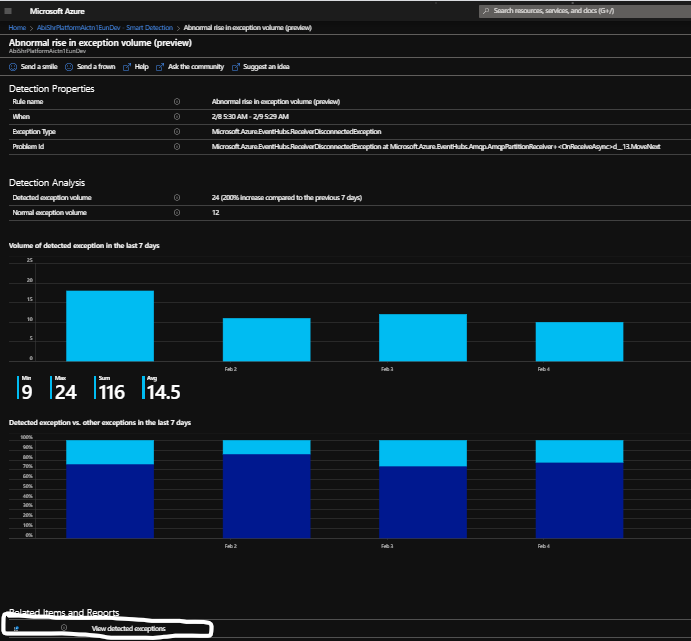
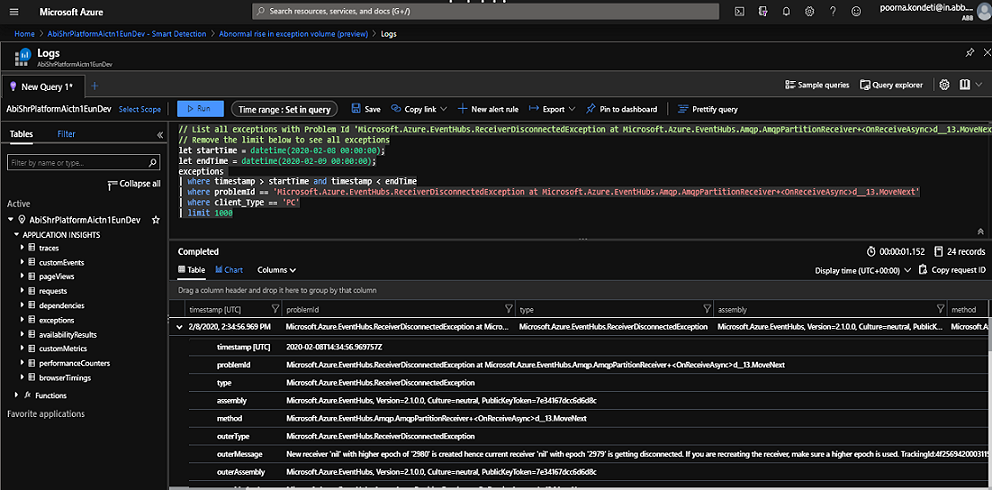
- Application Map: (Not accurately useful for Ability Platform) Here we have one more option to investigate errors in the platform (i.e., Application Mapping). Using this, we can troubleshoot as demonstrated in the following snapshots.
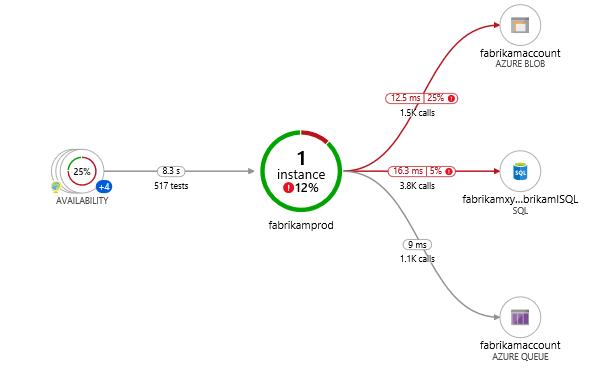
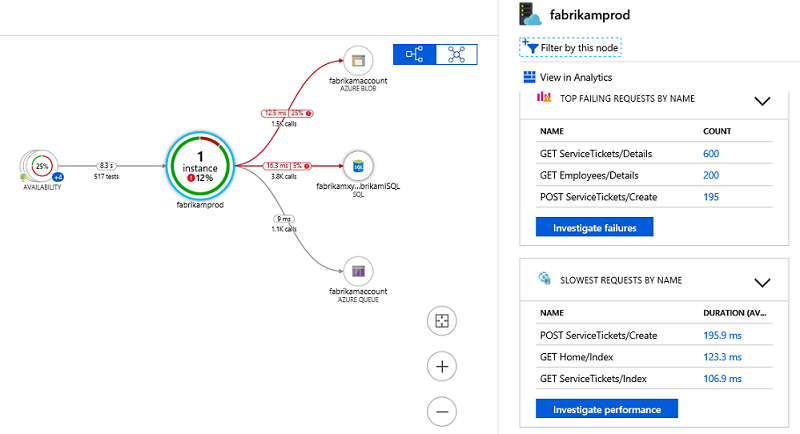
Failures Pane
In the Application Mapping, once you select the Investigate Failures option in the Application Pane, it takes us to the Failures Pane.
This is very useful to easily find errors (See Below).
Select Investigate Failure to launch the Failures Pane.
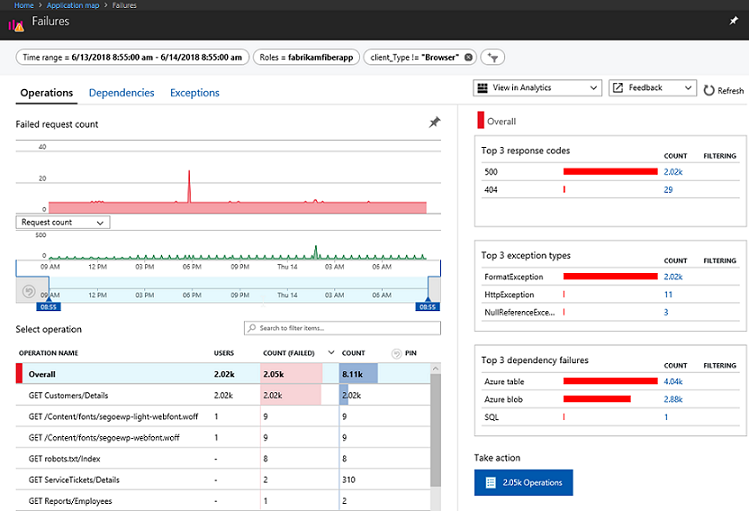
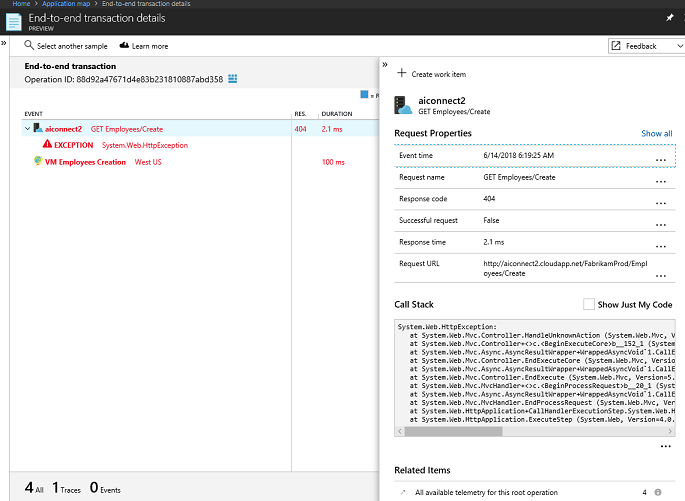
Select any of the Operation in the list to get end-to-end transaction details of the error/operation.
In the Application Mapping, we can check performance by selecting the Investigation Performance option to launch the Performance Pane as shown below.
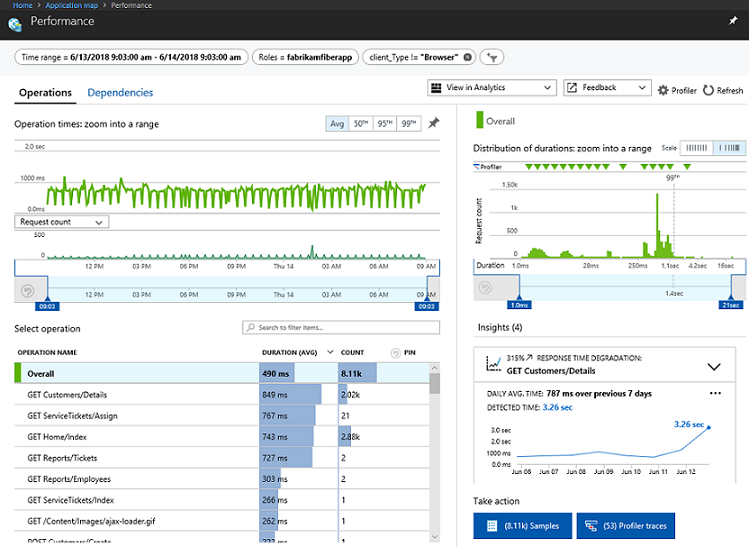
Select any of the listed operations to get end-to-end transaction details of that in another window as shown below.
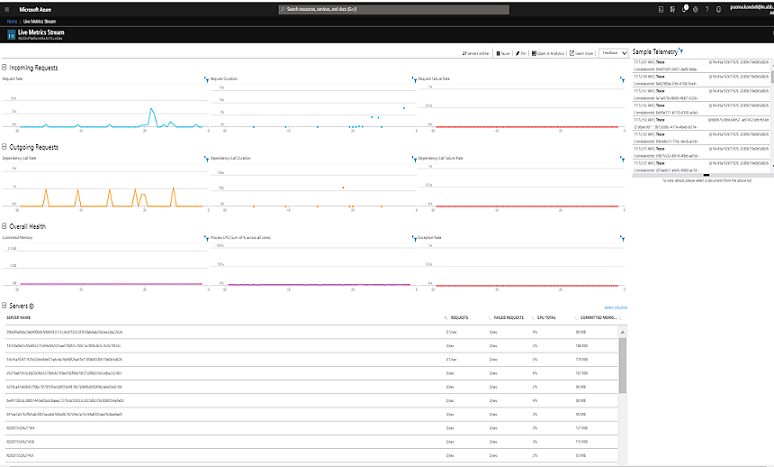
- Live Metrics Stream: This pane is self explanatory. Using this functionality, we will get live telemetry which is easy to trace errors using the timestamp. Select any of the telemetry traces to check the details or you can check the server performance from the server list.
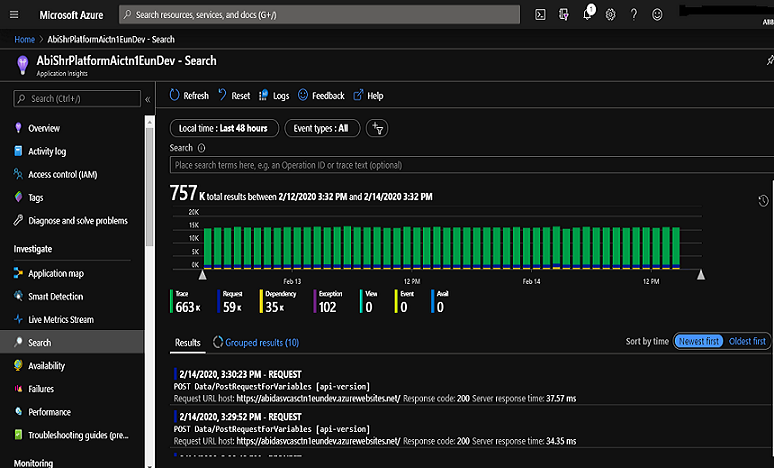
Search: This option, in the Investigation Pane, gets telemetry logs/details using different search keys.
In this Search option, we set Time Ranges to get accurate logs in that particular time interval.
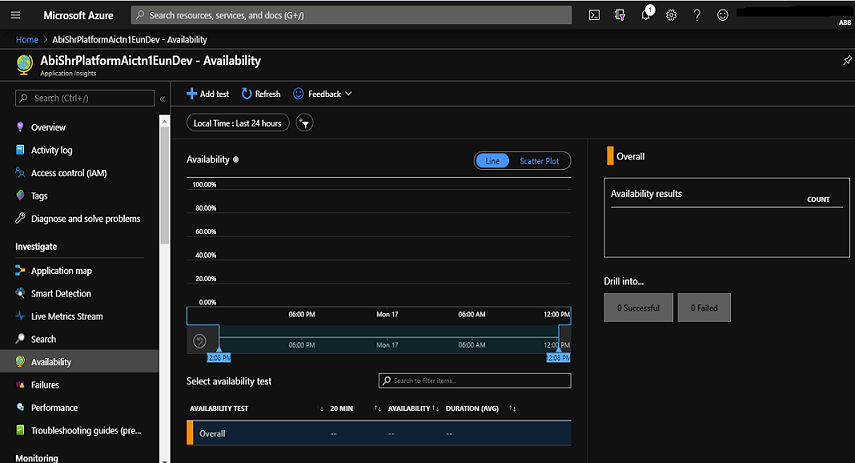
- Availability: Here we have one more option called Availability. This option helps to determine the availability of the platform. If there is any failures of the platform, we can see them in the Availability Dashboard.
Snapshot Debugger: This Snapshot Debugger automatically collects a debug snapshot from your live web application. The snapshot shows the state of the source code and variables at the moment an exception was thrown.
The Snapshot Debugger, in Azure Application Insights, monitors exception telemetry from your web application. It collects snapshots on your top-throwing exceptions so that you have the information you need to diagnose issues in production.
Note
As of now, this option is not enabled in Ability Platform
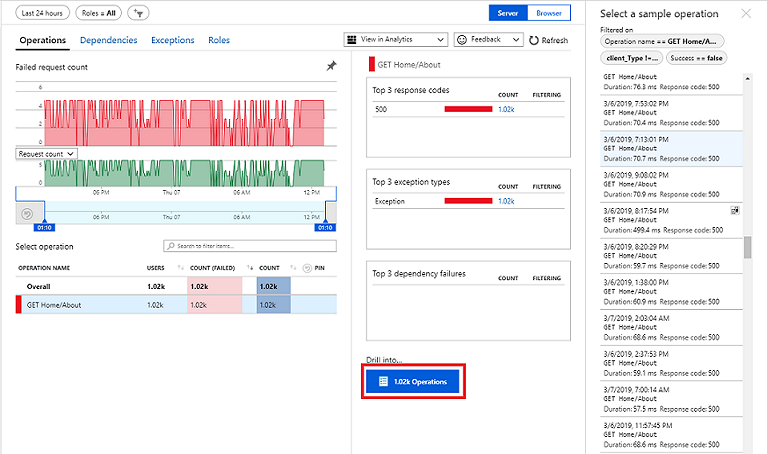
Profiler: Application Insights Profiler provides performance traces for applications that are running in production in Azure.
Profiler captures the data automatically at scale without negatively affecting your users.
By default, profiler traces are not enabled. For this, we need to configure it in Performances of Application Insights. Then we will trace the exceptions at code level as shown below.
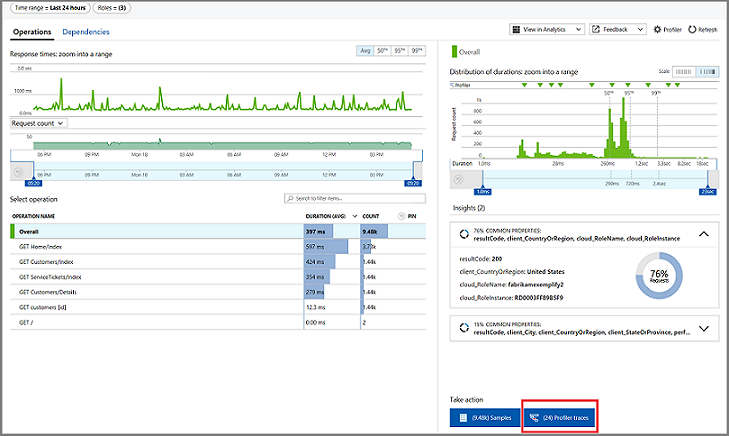
Example of Profile Traces:
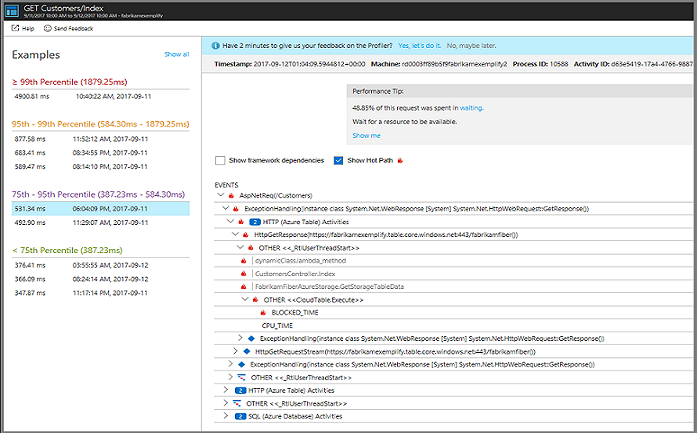
- Failures: In Application Insights, Failures collect all the exceptions from the platform. Using this, we can see end-to-end transaction details at once.
Note
In this pane we will get the option to enable Snapshot Debugger.
In this pane, we have multiple options called Operations, Dependencies, and Exceptions which we use to check all of the traces.
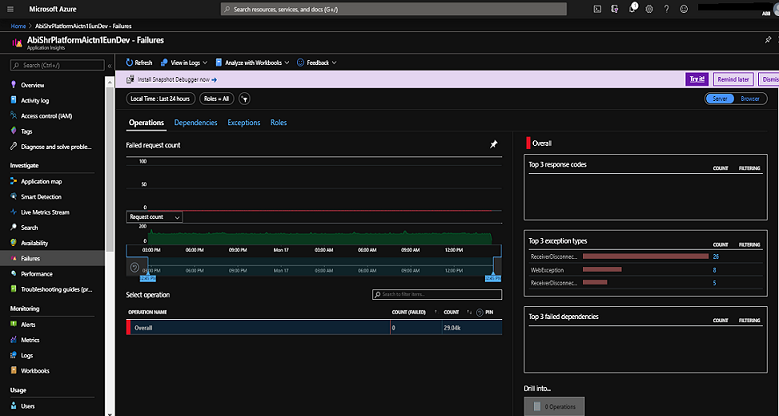
- Performance: Performance is a self explanatory pane in Azure Application Insights. Within this pane, we can check the overall performance of the platform and get all the traces. Using all these Application Insights Investigation options we can check all the End-to-End transactions of generated exceptions.
# Reference Links
| Link | Link |
|---|---|
| Application Insights | Smart Detection and Manual Alerts |
| Application Mapping | Profiler |
| Live Metrics Stream | Search |
| Availability | Snapshot Debugger |
| Failures | Performance |
